Whatever style of music you make, visualising your sound will help you to craft more professional mixes.
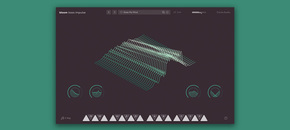
Excite Audio’s VISION 4X is an all-in-one visual analyser that helps you see your sound from all angles, featuring a spectrogram, bar graph, waveform and phase correlation meter. You can deploy VISION 4X to glean valuable information about the sounds in your track, and use that to make informed mixing decisions.
Let’s take a look at how the plugin works by putting it through its paces on four tracks from different eras with different mix techniques and musical styles: “Kashmir” by Led Zeppelin, “Nuthin’ but a ‘G’ Thang” by Dr Dre, “Dream Within a Dream” by Hans Zimmer and “Incessant” by Noisia. Each track will be analysed within VISION 4X as high-resolution 16-bit/44.1kHz FLAC files.
Comparing kick drums
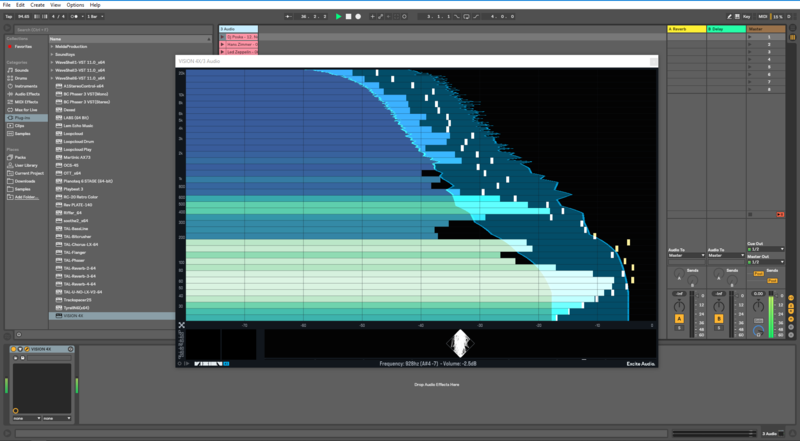
VISION 4X’s interface is split into four panels, each one housing a different tool for visual analysis of your audio. In the top left panel is VISION 4X’s powerful spectrogram, which provides more enhanced low end resolution than any other, offering access to detailed information about the frequencies in your mix.
How does a spectrogram work?
Before we analyse the tracks, let’s take a moment to familiarise ourselves with the way a spectrogram displays information about sound. You’ll no doubt be familiar with a waveform, which shows changes in an audio signal’s amplitude over time; a spectrogram is different in that it displays frequency changes in the signal over time. Amplitude is represented also, but as a third dimension, represented with variable brightness or colour.
The vertical axis of a spectrogram displays frequencies in Hertz, with the lowest at the bottom of the display and the highest at the top. The horizontal axis represents time, like a waveform.
Let’s use the spectrogram to take a look at the differences between the kick drums in “Kashmir”, a full throttle rock track that was originally recorded in 1974, and “Incessant”, a modern drum and bass track recorded in 2015.
Looping the kicks
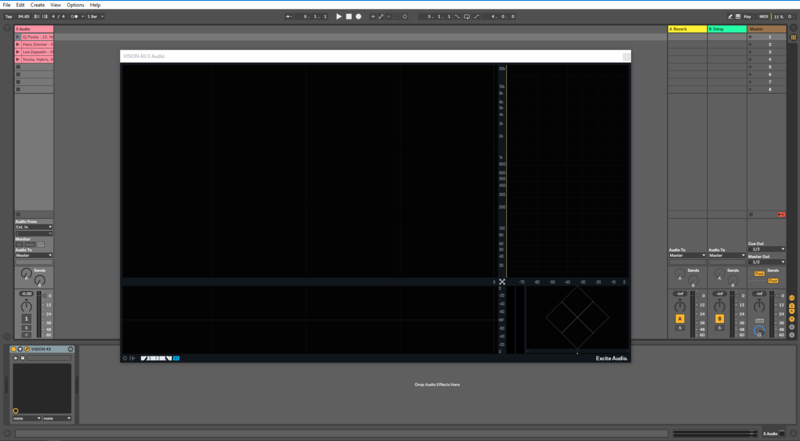
VISION 4X syncs with your DAW, making it easy to hone in on the sounds you want to analyse. For each track, we can loop a section during a sparse moment in the mix and take a look at how the kick drum is coming across on the spectrogram. It’s important to note that if we had the stems from the original recordings, we would be able to visualise the kicks in total isolation, but by using the full tracks there is a little more going on around them in the mix.
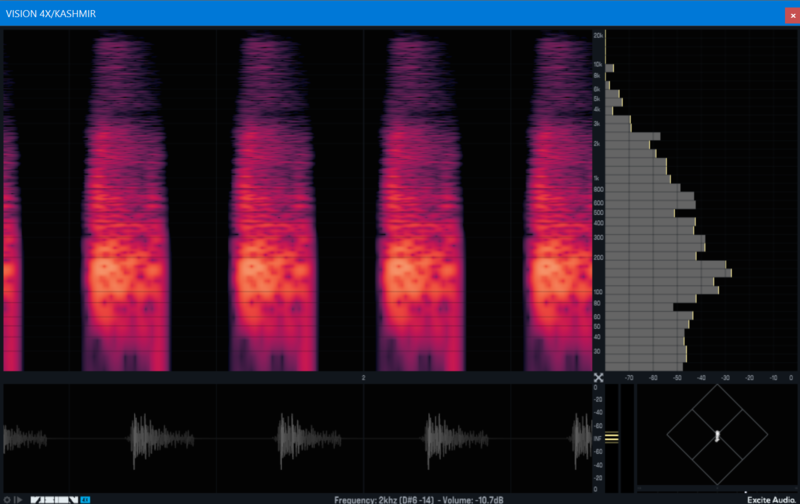
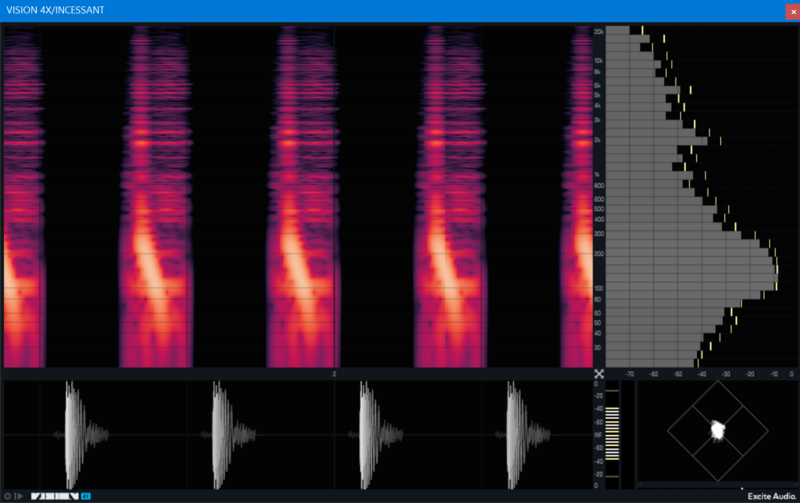
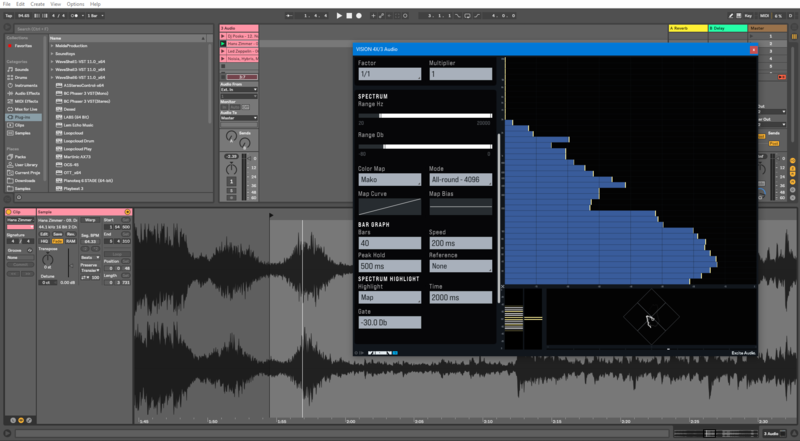
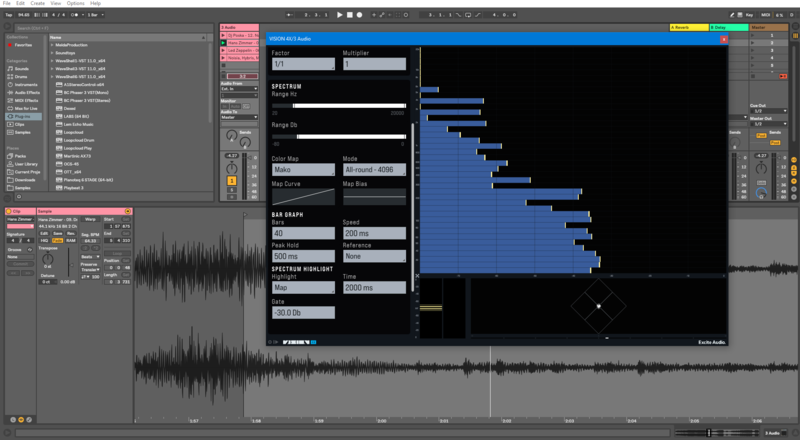
As you can see from the Led Zeppelin track in the image above and the Noisia track in the image below, there is an obvious discrepancy between the two kicks. Noisia’s kick drum is expressed as a white hot line that curves down into the sub frequencies, whereas Led Zeppelin’s kick has a much more diffuse profile.
Electronic vs acoustic
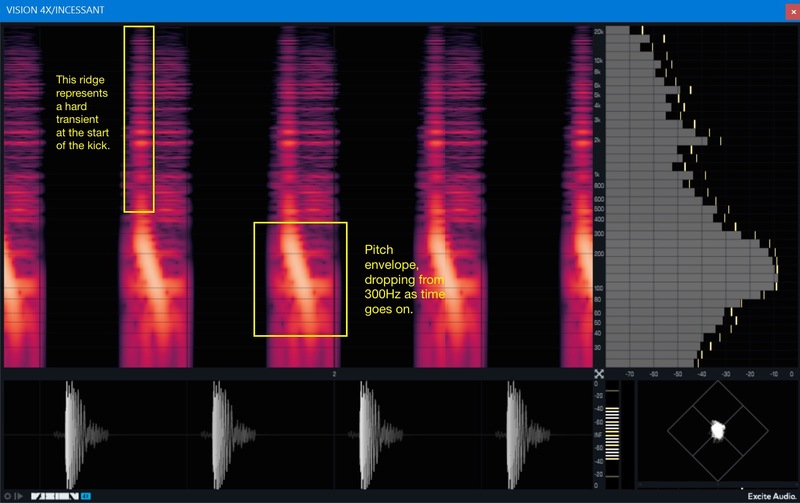
Looking at the Noisia kick, the first thing to point out is the long ridge of brightness at the top left of the sound. This represents a hard transient at the start of the kick. The ridge covers most of the frequency spectrum, from about 400Hz up, which means it is very impactful and cuts through the mix.
To the right of the ridge, the streaks of brightness emanating outwardly over time suggest some sort of harmonic distortion, as more harmonics are brought out higher up the frequency spectrum.
The majority of electronic sounds use a sine wave for the kick body, following a sharply decaying pitch envelope. The pitch decreases rapidly until it bottoms out at a low frequency (usually between 40 and 60Hz). The speed and shape of this envelope determine the character of the kick drum.
If you look at the bottom half of the Noisia kick drum represented on the spectrogram, you can see where the sound transitions out of the transient with a pitch envelope dropping from 300Hz to around 60Hz as time goes on. The high frequencies drop out very quickly, settling within a few milliseconds on the low pitch, which makes this a very tight electronic kick.
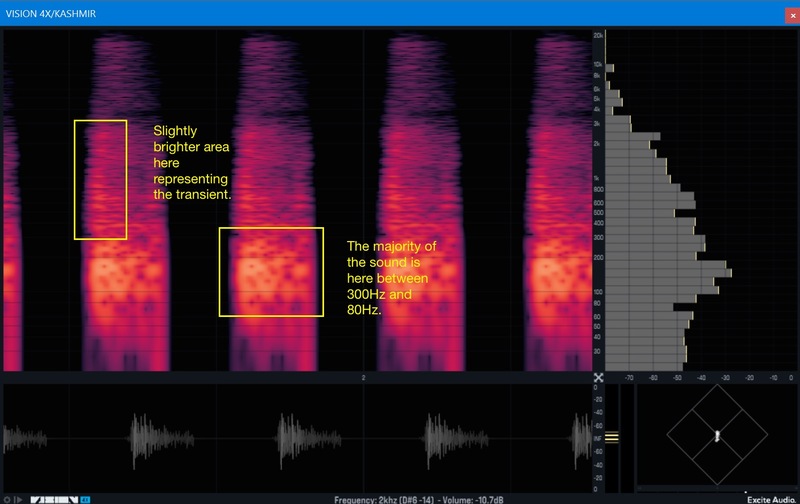
With the Led Zeppelin kick drum being acoustic, and thus recorded through a microphone, the character of the sound is totally different. The majority of the kick’s body is between 300Hz and 80Hz, with no evidence of a strong transient, making it much more woolly and undefined than the Noisia kick.
Analysing the mixes
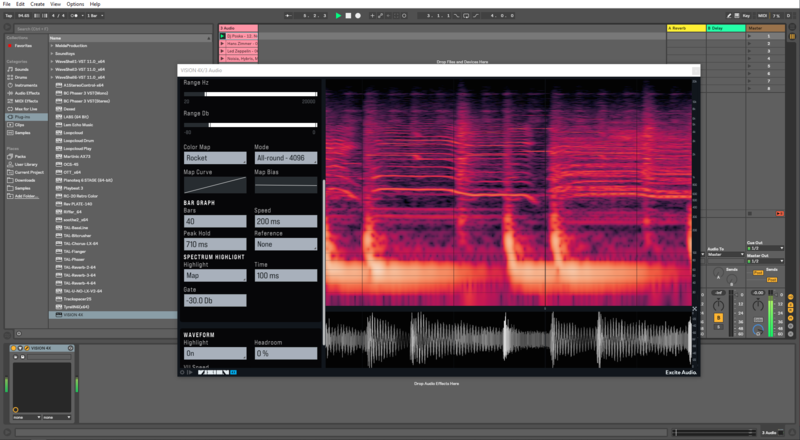
To the right of the spectrogram is VISION 4X’s bar graph, a fully customisable spectrum analyser that can highlight the gain levels of the sustained frequencies in your sound. You can view the bar graph vertically, or flip it on its side if you prefer.
Let’s take a look at the overall differences between the tracks using the bar graph. With VISION 4X on your master bus, you can get a zoomed out view of how the frequencies are balanced in your mix, and make EQ decisions accordingly.
Reading frequency distribution
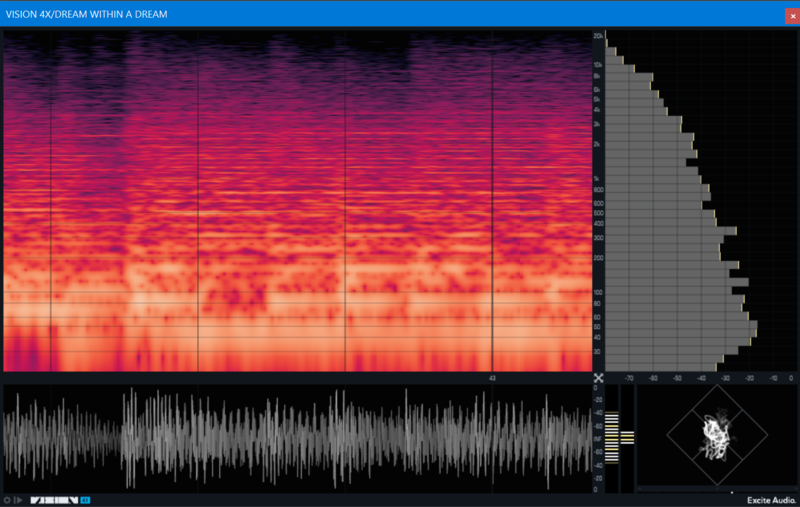
“Dream Within a Dream” is a rousing orchestral track from the Inception soundtrack, and it has all the hallmarks of a Hans Zimmer score, most notably a steadily increasing sense of tension and unease peppered by massive blasts of ensemble brass.
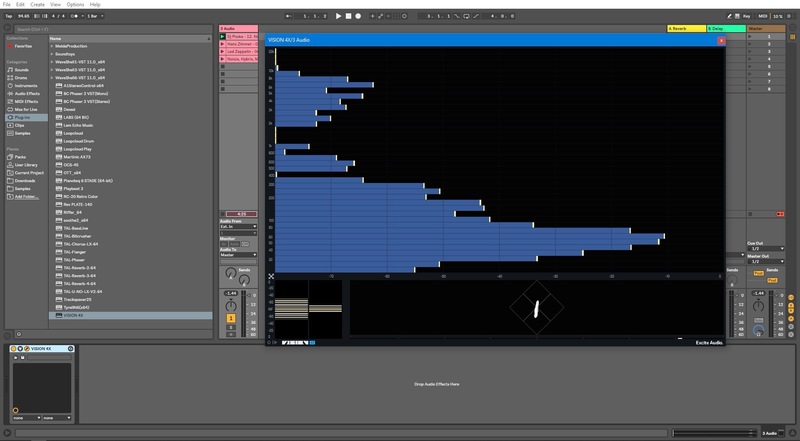
Action movie soundtracks contain a lot of rumble and sub frequencies, as they’re designed to reverberate around the chests of the audience. If we take a look at the bar graph during a subby FX rumble, we can see that born out in the balance of frequencies displayed. Most of the sound resides below 1kHz, with a strong buildup of energy between 30–70Hz. On the other hand, there’s nothing at all above 3kHz.
In the section that immediately follows this one, an ominously low pitched cello part starts to build in intensity, with the violin section playing an eerie high pitched sustained note above it. We can see these two contrasting sounds represented on the bar graph, particularly with the presence of frequency information between 3–5kHz. If the violins were being overpowered or buried in the mix, we would be able to notice their lack of representation in those frequencies.
808 power
In Dr Dre’s track “Nuthin’ but a ‘G’ Thang”, a classic from the G-funk era of hip hop, we can clearly identify the 808 thumping through the mix between 30–80Hz. From the early 80s on. producers in the emerging genres of hip hop and dance music capitalised on the booming bass drum of the Roland TR-808 to make car stereos, ghetto blasters and club speaker systems vibrate.
If we compare the overall balance of frequencies within “Nuthin’ but a ‘G’ Thang” with “Dream Within a Dream” you can see a lot more fluctuation across the spectrum in the hip hop track. This is to be expected, as there are considerably less elements contributing to the mix than in Hans Zimmer’s epic soundtrack.
Using reference curves
VISION 4X also allows you to compare your mix with reference curves from a range of genres, generated through in-depth analysis of hundreds of tracks. Each reference curve has an average and a maximum value line, with overshooting clearly indicated in red, so you’ll see how your mix is stacking up.
With the ‘DnB - Hard’ reference curve selected, you can see that the high frequencies from 5kHz up of “Nuthin’ but a ‘G’ Thang” are falling well short, as is everything below 30Hz. Apply the same reference curve to Noisia’s track Incessant though, and you’ll see the mix is hitting the mark pretty much across the spectrum, which is no surprise considering it’s a drum & bass track.
Harmonic density
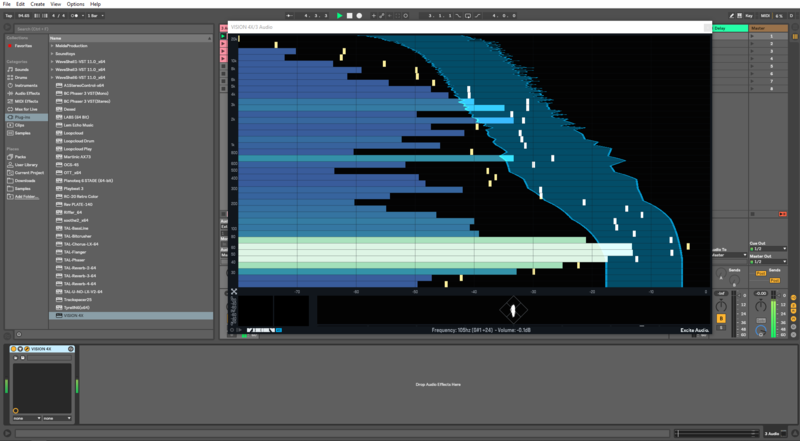
Switching to the spectrogram view, the contrast in harmonic density between the two tracks is even more apparent, with “Dream Within a Dream” displaying a consistent spread of sound across the frequency spectrum. What you’re seeing here is a visual representation of the power of an orchestra playing in unison.
“Nuthin’ but a ‘G’ Thang” on the other hand, has plenty of power in the 30-60Hz range, with long 808 blasts showing up at the bottom. There’s a much sparser spread across the rest of the spectrum, but we can pick up some interesting detail where the vocals are cutting through the mix.
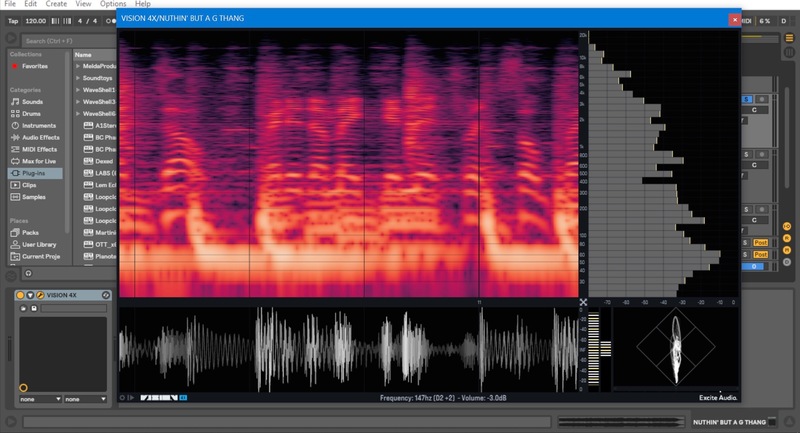
In the call and response intro section of the track, we can pick out the main body of a solo voice represented by a thin line at around 600Hz, immediately answered by a cluster of vocal harmonies afterwards.
All in all, visual analysers are helpful mixing aids that all producers should have in their arsenal. Aside from giving you access to more detailed information about what’s going on in your mix, they can also be useful for the times when you don’t have access to high quality monitors, for example when you’re tinkering with a project on the go. With four powerful visualizers in one, VISION 4X is a convenient and effective tool that will help you to get more professional sounding tracks.